
Geckoboard & Watchy Dec 10 2010
As I previously mentioned, I recently launched a web app called Watchy with Kat Neville. Also, I’ve recently received a beta invite to test out Geckoboard, a fantastic dashboard application that lets you add widgets displaying data from various sources, to construct a dashboard full of useful information. Seeing as how some of the most useful information that I want to see throughout my day usually pertains to my business, and specifically the business analytics and calculations we have in Watchy, I thought it’d be a great idea to build some basic Geckoboard widgets into Watchy to bridge the gap.

These widgets aren’t public in Watchy yet, however if you use Watchy and Geckoboard and think they might interest you, then please get in touch with me and I can setup your Watchy account so that you have access to them. Likewise if you’re a Geckoboard user who also uses FreeAgent and would love to access these stats on your dash, then please sign up for a Watchy account, and then get in touch so I can get you setup. These widgets will be a feature of paid accounts when we exit beta and launch paid plans on Watchy, but for anyone who helps me test them now, I’ll make sure that you get to keep your access to them, regardless of whether you move on to a paid Watchy plan or not.
We have three types of widgets, each with a multitude of data to show. The three types are:
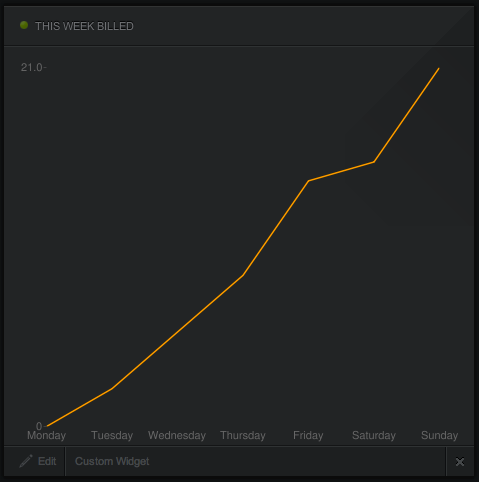
Line chart widget
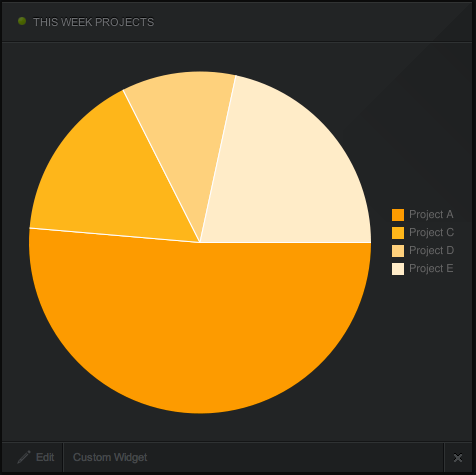
Pie chart widget
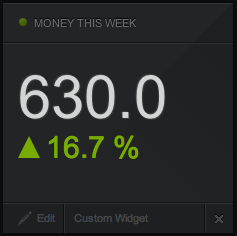
Text widget
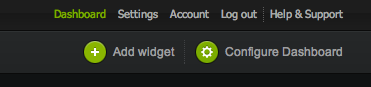
Now on to the good bit, the instructions for adding a Watchy widget to your Geckoboard dashboard. First things first, lets click Add Widget on the top right of our Geckoboard user interface (you’ll need the top menu showing if it isn’t already):
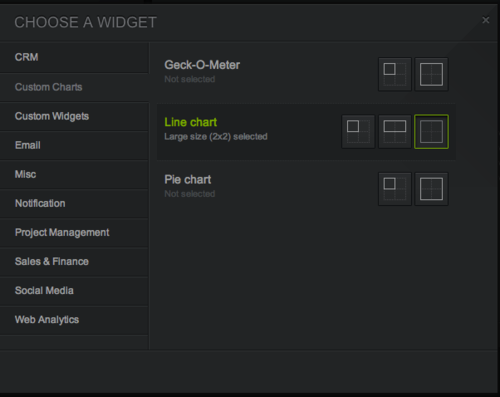
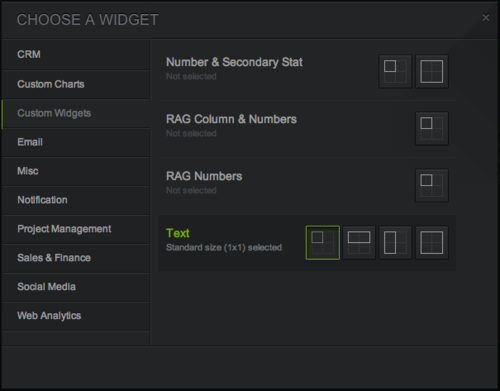
You then need to choose the type of widget required. For a line or pie chart widget, you need to select “Custom Charts” from the list on the left, for a text widget, select “Custom Widgets”.
For a line chart widget, a 2x2 panel size works best:
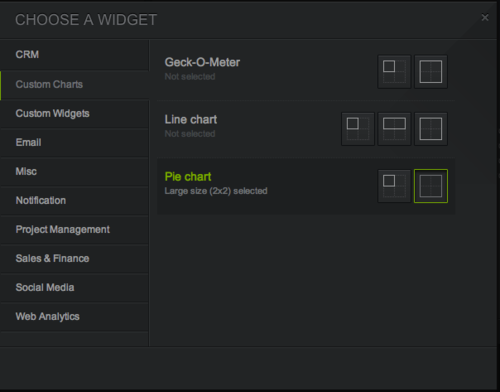
For a pie chart, a 2x2 size also works best:
For the text widgets, a 1x1 size seems to work best:
Regardless of the widget you are adding, once you’ve selected the type and size of widget, you’ll see this form:
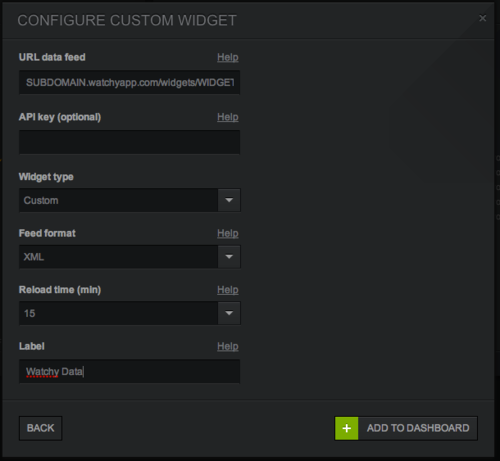
Lets run through the fields:
URL data feed is the most important one. The URL should look like this: http://SUBDOMAIN.watchyapp.com/widgets/WIDGET.xml?api_token=API_TOKEN. You’ll need to replace SUBDOMAIN with the subdomain you use to access your Watchy account, WIDGET with the name of the widget you want to add, and API_TOKEN with the API token that is shown on your Account Settings page on Watchy once you have contacted me and asked me to enable API access for you (in due course, you’ll be able to enable and disable API access yourself from the Account Settings page).
So what widgets are available? Here is a rundown of the widgets exposed by Watchy, and the name that you need to use in place of WIDGET in the URL data feed field:
- average_week_billable_line - this shows an accumulative line chart of billable time based on an average week, calculated over the last four weeks
- average_week_unbillable_line - this shows an accumulative line chart of unbillable time based on an average week, calculated over the last four weeks
- last_week_billable_line - this shows an accumulative line chart of billable time for last week
- last_week_unbillable_line - this shows an accumulative line chart of unbillable time for last week
- this_week_billable_line - this shows an accumulative line chart of billable time for this week
- this_week_unbillable_line - this shows an accumulative line chart of unbillable time for this week
- average_pie - this shows a pie chart breakdown of the time spent on various projects, calculated on an average over the last four weeks
- last_week_pie - this shows a pie chart breakdown of the time spent on various projects last week
- this_week_pie - this shows a pie chart breakdown of the time spent on various projects this week
- billable_time_this_month_text - this shows the billable time so far for this month as a figure, with a % increase/decrease based on the same time last month
- billable_time_this_week_text - this shows the billable time so far for this week as a figure, with a % increase/decrease based on the same time last week
- billable_time_today_text - this shows the billable time so far today as a figure, with a % increase/decrease based on total time for yesterday
- money_this_month_text - this shows the money earned based on billable time so far this month, with a % increase/decrease based on the same time last month
- money_this_week_text - this shows the money earned based on billable time so far this week, with a % increase/decrease based on the same time last week
- money_today_text - this shows the money earned based on billable time so far today, with a % increase/decrease based on the total money earned yesterday
- unbillable_time_this_month_text - this shows the unbillable time so far for this month as a figure, with a % increase/decrease based on the same time last month
- unbillable_time_this_week_text - this shows the unbillable time so far for this week as a figure, with a % increase/decrease based on the same time last week
- unbillable_time_today_text - this shows the unbillable time so far today as a figure, with a % increase/decrease based on total time for yesterday
So for example, if my subdomain is “test”, my API token is “1234567890”, and the widget I want to use is “money_today_text”, then the URL to use would be:
http://test.watchyapp.com/widgets/money_today_text.xml?api_token=1234567890
The optional API key field can be left blank, as our API key/token is within the URL.
The widget type should be set as “Custom”.
The feed format should be set as “XML”.
The reload time can be set based on personal preference, I have mine set to 15 minutes. It is possible that in the future we may introduce rate limiting for API tokens, to stop overuse of the API, and so I’d ask that you please only set a refresh rate that is necessary for the stats that you want to keep up to date, inline roughly with how often you post new timeslips to FreeAgent.
The label can be set to whatever you want to see on the widget itself, so usually it pertains to the type of data you have chosen to show.
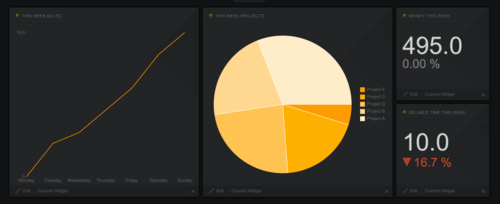
And that’s all there is to it! You can add as many or as few widgets as you can find room for on your dashboard, and you can end up with a great, at-a-glance view of your business analytics like this:
So please, if you use FreeAgent and you’d like to give these widgets a go, then sign up for Watchy if you haven’t done so already, and then get in touch so I can enable API access for you and give you an API token.
Any feedback on the widgets is much appreciated, as are suggestions for how they can be improved, or indeed any additional widgets that people would like to see!
watchy • freeagent • geckoboard • widgets • business analytics • useful